Background
PERKS is promotional incentive program that rewards customers for increasing their spend on coffee & breakroom products.
Customers were able to track their progress by logging onto a website that was developed and maintained by a third party.
The Problem
The expense to maintain and upgrade the existing PERKS website was too high, so I was asked to find a more affordable way to effectively communicate progress to customers.
Discovery
While interviewing the program owners, I learned that there was currently a very small number of participants and progress data on the current website was only updated once a month. The website did not have a live, continuous connection to a data source, so the process of updating was manually intensive, and most of the data. Traffic to the site – even considering the low number of participants – was abysmal.
Constraints & Assumptions
Given the realities of the program, I was given a budget of approximately $0 and five weeks to have a final product, whatever that may be.
I wasn’t going to be able to deliver a new website. I also assumed we would not be able to eliminate the manual data process, but could I simplify it? Only in-house resources would be available to me.
Solution
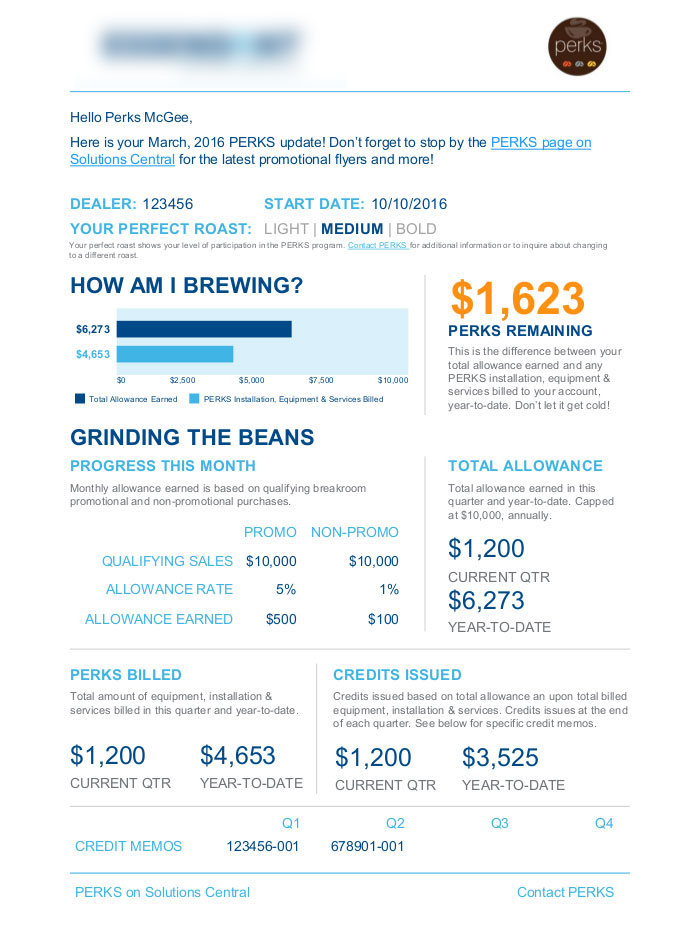
I offered the program owners an alternative to a website: an email. Using systems already in place, an email could be personalized with the same or similar type of reports that were being manually fed to the existing website, so the challenge was to design an email that would quickly convey the most important information, and hopefully help simplify the internal work to process the data.
Validation
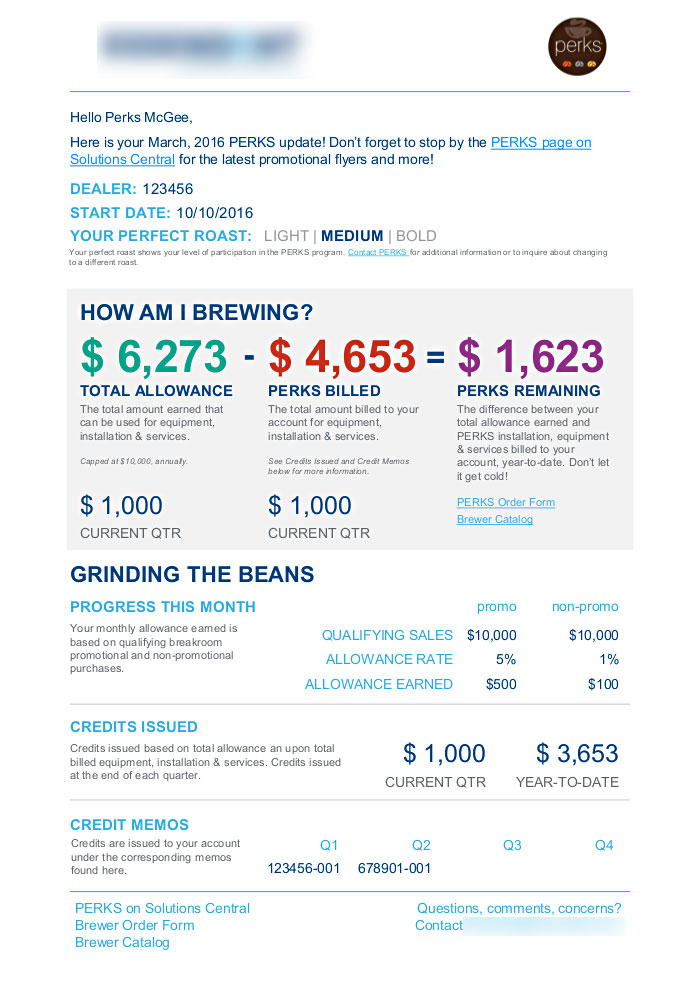
After a few revisions, the design was shown to some existing customers. Based on their feedback and further discussion with the design team, I decided to removed the visual graph and replace it with an equation.
The revised design was shown to a different set of existing customers who latched on to the simplicity and easy-to-understand equation. They commented about how they immediately knew how they were preforming and then could dig into the other numbers for more information.
The process was simplified internally as well. Finance used to provide a multi-tabbed spreadsheet of what I affectionately like to call data vomit for each participating customer.
Now, a flat-file with a single line-item for each customer containing just the critical reported metrics would be provided to the internal email team.
Fun Facts
- When I did this project I didn’t have any dedicated wireframing software yet, so I created this in Microsoft PowerPoint.
- During my team’s weekly design review sesh, I was showing some of my early low fidelity wireframes with coffee related puns as heading placeholders, never intending them for the final product. After a few rounds of revisions and changes, the puns are the only original element that survived from beginning to end.